The US hosts more large-scale B2B events than any other country. With over 13,000 trade shows running each year and an events market valued at more than $466 billion, the sheer volume of options available to exhibitors is both an opportunity and a problem. Not every large event is the right event for your business — and not every event that looks impressive on paper will deliver the pipeline your sales team needs.
This guide goes beyond a simple list. Alongside the 50 largest annual in-person events in the US, you will find attendance figures, industry classifications, 2026 dates, and a proprietary exhibitor tier rating that reflects the realistic opportunity at each event — not just how big the crowd is. You will also find a section on how to evaluate any event on this list before committing your budget.
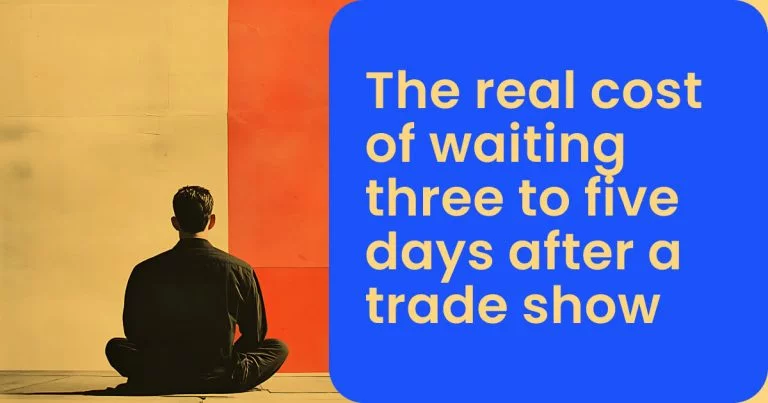
Before you dive in, one number is worth keeping in mind: 80% of event leads are never followed up. That is not an attendance problem. It is an execution problem — and it starts with choosing the right events and having the right systems in place before the show begins. You can read more about that in momencio’s guide to trade show management.
The US trade show industry: key numbers for 2026
Before looking at individual events, it helps to understand the broader landscape. These figures give context to why event selection and execution quality matter so much.
| $466B | US events market value in 2025 — projected to reach $651B by 2032 |
| 13,000 | Annual trade shows held across the United States |
| 81% | Of trade show attendees have authority to buy or directly influence purchasing decisions |
| $112 | Average cost per trade show lead vs. $259 for a traditional field sales call |
| 46% | Of trade show attendees are in the final stages of their buying process when they attend |
| 80% | Of event leads are never followed up — the single largest source of lost trade show ROI |
Sources: Kande Photo Booths Trade Show Statistics 2026; momencio trade show ROI research.
What the data tells us: key insights from the top 50
Before scrolling to the full list, these patterns are worth noting. They emerge from analysing all 50 events by attendance, geography, industry, and exhibitor opportunity — and they inform how you should read the table below.
| 📊 Key insights from the 50 largest US events |
Las Vegas hosts more top-50 events than any other US city — over 20 of the 50 events on this list are held there, driven by the LVCC's 14.5 million square feet of venue space. Chicago is the second major hub, anchored by McCormick Place, North America's largest convention centre at 2.6 million sq ft. Manufacturing, healthcare, and food service dominate its calendar. The top 10 events by attendance collectively draw over 1.7 million attendees — but raw attendance does not equal lead quality. Several 'Selective' tier events on this list consistently outperform larger shows for qualified buyer access. Healthcare and life sciences account for the highest number of vertical-specific events in the top 50 — eight events across oncology, radiology, orthopedics, cardiology, paediatrics, haematology, HVACR, and healthcare IT. Agriculture dominates raw attendance numbers. EAA AirVenture Oshkosh (686,000) and the National Farm Machinery Show (300,000) sit at the very top — yet they serve highly specialised sectors. Technology events deliver the highest concentration of senior decision-makers per square foot. CES (141,000+) and Dreamforce (170,000) consistently report that over 60% of attendees hold director-level titles or above. Manufacturing and construction shows biennial cadence matters: IMTS and Pack Expo run every two years, meaning participation decisions carry more weight — and more lead-capture preparation time. |
How to read this list: understanding the exhibitor tier rating
Every event on this list has been assigned one of three exhibitor tier ratings. This rating is not based solely on attendance. It reflects the realistic opportunity for an exhibitor — taking into account audience composition, buyer-to-browser ratio, lead complexity, and the general conversion profile of the event type.
| Tier | What it means | Best suited for |
| Premier | 100,000+ attendees. National or global reach, heavy media coverage, large exhibitor floor. | Brand awareness, product launches, senior-level relationship building. |
| High | 30,000–99,999 attendees. Strong industry representation, serious buyer traffic. | Pipeline generation, qualified lead capture, category leadership positioning. |
| Selective | Under 30,000 attendees. Niche, but often the highest decision-maker concentration. | Deep-funnel conversations, partnership development, specialized market penetration. |
A Selective tier event is not a consolation prize. In many cases, a 15,000-person medical conference where 80% of attendees are hospital procurement leads will produce more pipeline than a 150,000-person consumer expo where your target audience makes up less than 5% of the crowd. Read the tier as a signal of fit and conversion potential, not prestige.
| 💡 Exhibitor note: size vs. signal |
The exhibitor tier is based on audience quality, not crowd size. A 'Selective' rating means the event has a high concentration of qualified buyers relative to its size — often making it a more efficient investment than a larger 'Premier' event in the wrong vertical. When evaluating any show, compare your estimated qualified conversations (not total footfall) against your all-in cost: booth space, travel, staffing, collateral, and follow-up systems. See the evaluation framework later in this article for a structured way to make that comparison. |
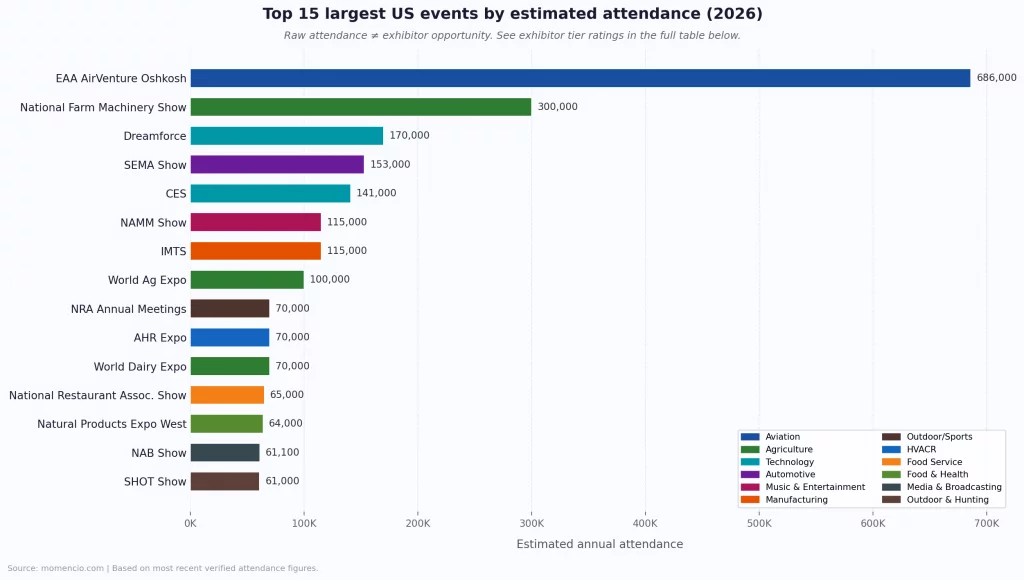
The 10 largest US events by attendance: a quick-reference guide
The table below covers the top 10 events ranked by estimated annual attendance. Each entry includes a brief exhibitor perspective — the kind of context you will not find in a standard event directory.
| Rank | Event | Attendance | Industry | Why it matters for exhibitors |
| 1 | EAA AirVenture Oshkosh | 686,000 | Aviation | Highest single-show attendance in the US. Very niche but massive audience loyalty. |
| 2 | Dreamforce | 170,000 | Technology | Decision-makers at every level. High-value B2B leads across software and services. |
| 3 | CES | 141,000+ | Technology | Global media spotlight. Ideal for launches, brand visibility, and tech partnerships. |
| 4 | SEMA Show | 153,000 | Automotive | Aftermarket-focused. High buyer intent from retailers and distributors. |
| 5 | IMTS | 115,000 | Manufacturing | Biennial. Long buying cycles but extremely qualified decision-makers on the floor. |
| 6 | NAMM Show | 115,000 | Music / Entertainment | Tightly targeted industry. Strong relationship-building with retailers and media. |
| 7 | World Ag Expo | 100,000 | Agriculture | Outdoor event, active buyers, regional business-growth focus. |
| 8 | NRA Annual Meetings | 70,000+ | Outdoor / Shooting Sports | Values-driven attendees with strong brand loyalty and purchasing intent. |
| 9 | AHR Expo | 70,000 | HVACR | Deep technical audience. Trade contractors and specifiers dominate attendance. |
| 10 | World Dairy Expo | 70,000 | Dairy / Agriculture | Specialised agricultural audience, significant purchasing decisions made on-site. |
See the full list of all 50 events in the next section. For a deeper read on maximising your presence at large-scale events, see momencio’s ultimate guide to trade show marketing.
All 50 largest annual in-person events in the US (2026)
The table below lists all 50 events with city, estimated attendance, industry classification, exhibitor tier, and approximate 2026 timing. Event names are linked to their official websites. Dates are subject to change — always confirm on the official site before booking.
| 📌 How to use this table |
Sort by industry to identify the events most relevant to your sector. Use the exhibitor tier column to shortlist events by lead quality rather than attendance size alone. Cross-reference the 2026 window with your marketing calendar to plan booth investment and pre-event outreach timing. |
| # | Event | City | Est. Attendance | Industry | Exhibitor tier | 2026 window |
| 1 | EAA AirVenture Oshkosh | Oshkosh, WI | 686,000 | Aviation | Premier | Jul 2026 |
| 2 | National Farm Machinery Show | Louisville, KY | 300,000 | Agriculture | Premier | Feb 2026 |
| 3 | World Ag Expo | Tulare, CA | 100,000 | Agriculture | High | Feb 2026 |
| 4 | Consumer Electronics Show (CES) | Las Vegas, NV | 141,000+ | Technology | Premier | Jan 2026 |
| 5 | SEMA Show | Las Vegas, NV | 153,000 | Automotive | Premier | Nov 2026 |
| 6 | Dreamforce | San Francisco, CA | 170,000 | Technology | Premier | Sep 2026 |
| 7 | NAMM Show | Anaheim, CA | 115,000 | Music & Entertainment | High | Jan 2026 |
| 8 | NAB Show | Las Vegas, NV | 61,100 | Media & Broadcasting | High | Apr 2026 |
| 9 | Natural Products Expo West | Anaheim, CA | 64,000+ | Food & Health | High | Mar 2026 |
| 10 | NRA Annual Meetings | Houston, TX | 70,000+ | Outdoor/Shooting Sports | Selective | Apr 2026 |
| 11 | HIMSS Global Health Conference | Las Vegas, NV | 25,000+ | Healthcare IT | High | Mar 2026 |
| 12 | National Restaurant Association Show | Chicago, IL | 65,000 | Food Service | High | May 2026 |
| 13 | SHOT Show | Las Vegas, NV | 61,000 | Outdoor & Hunting | High | Jan 2026 |
| 14 | International Builders’ Show (IBS) | Las Vegas, NV | 70,000+ | Construction | High | Feb 2026 |
| 15 | AHR Expo | Chicago, IL | 70,000 | HVACR | High | Jan 2026 |
| 16 | IMTS | Chicago, IL | 115,000 | Manufacturing | Premier | Sep 2026 |
| 17 | ProMat | Chicago, IL | 50,000 | Supply Chain | High | Mar 2026 |
| 18 | World of Concrete | Las Vegas, NV | 60,000 | Construction | High | Jan 2026 |
| 19 | MAGIC Las Vegas | Las Vegas, NV | 60,000 | Fashion & Apparel | Selective | Feb 2026 |
| 20 | Pack Expo International | Chicago, IL | 48,000 | Packaging & Processing | High | Oct 2026 |
| 21 | Offshore Technology Conference (OTC) | Houston, TX | 60,000 | Energy | High | May 2026 |
| 22 | ISC West | Las Vegas, NV | 30,000 | Security | Selective | Apr 2026 |
| 23 | InfoComm | Las Vegas, NV | 44,000 | AV & Technology | High | Jun 2026 |
| 24 | RSNA Annual Meeting | Chicago, IL | 50,000 | Radiology / Medical | Selective | Nov 2026 |
| 25 | ASCO Annual Meeting | Chicago, IL | 40,000 | Oncology | Selective | May 2026 |
| 26 | NRF Big Show | New York, NY | 40,000 | Retail | High | Jan 2026 |
| 27 | IAAPA Expo | Chicago, IL | 38,000 | Attractions & Amusement | Selective | Nov 2026 |
| 28 | FABTECH | Chicago, IL | 42,000+ | Metalworking | High | Nov 2026 |
| 29 | SHRM Annual Conference | San Diego, CA | 25,000+ | HR & Workforce | High | Jun 2026 |
| 30 | AAOS Annual Meeting | San Diego, CA | 30,000 | Orthopaedic Surgery | Selective | Mar 2026 |
| 31 | ACC Annual Scientific Session | Chicago, IL | 30,000 | Cardiology | Selective | Mar 2026 |
| 32 | IWF Atlanta | Atlanta, GA | 30,000 | Woodworking | Selective | Aug 2026 |
| 33 | Toy Fair New York | New York, NY | 25,000 | Toy & Game | Selective | Sep 2026 |
| 34 | NADA Show | Las Vegas, NV | 22,000 | Automotive Retail | Selective | Feb 2026 |
| 35 | ASH Annual Meeting | San Diego, CA | 25,000 | Hematology | Selective | Dec 2026 |
| 36 | International Roofing Expo (IRE) | Las Vegas, NV | 17,000 | Roofing | Selective | Feb 2026 |
| 37 | MRO Americas | Atlanta, GA | 17,000+ | Aviation MRO | Selective | Apr 2026 |
| 38 | Groceryshop | Las Vegas, NV | 5,000+ | Grocery / CPG | Selective | Sep 2026 |
| 39 | WEFTEC | New Orleans, LA | 20,000+ | Water / Environmental | Selective | Sep 2026 |
| 40 | World Dairy Expo | Madison, WI | 70,000 | Dairy / Agriculture | Selective | Oct 2026 |
| 41 | AAP National Conference | Washington, D.C. | 15,000 | Paediatrics | Selective | Oct 2026 |
| 42 | SATELLITE Conference | Washington, D.C. | 15,000 | Satellite / Space Tech | Selective | Mar 2026 |
| 43 | ARA Show | Las Vegas, NV | 15,000 | Equipment Rental | Selective | Jan 2026 |
| 44 | G2E – Global Gaming Expo | Las Vegas, NV | 25,000+ | Gaming & Casino | Selective | Sep 2026 |
| 45 | NBAA-BACE | Las Vegas, NV | 30,000+ | Business Aviation | High | Oct 2026 |
| 46 | IBEX Expo | Tampa, FL | 8,000+ | Marine / Boatbuilding | Selective | Oct 2026 |
| 47 | IPC APEX Expo | Anaheim, CA | 9,000 | Electronics Manufacturing | Selective | Mar 2026 |
| 48 | MANTS | Baltimore, MD | 12,000 | Horticulture | Selective | Jan 2026 |
| 49 | MJBizCon | Las Vegas, NV | 35,000+ | Cannabis | Selective | Dec 2026 |
| 50 | RAPID + TCT | Detroit, MI | 5,000 | 3D Printing / Additive Mfg | Selective | Apr 2026 |
* Attendance figures are estimates based on most recent verified data. Some events are biennial (held every two years). Always confirm schedules and attendance projections directly with event organisers.
| 📖 Related reading from momencio |
→ Top 50 largest trade shows in the United States (2026) → Top 25 networking events in the United States → How to turn lead data into proprietary event intelligence |
Where are the largest US events concentrated?
Geography matters more than most exhibitors realize. Venue capacity, hotel infrastructure, and flight access all affect both your costs and your attendees’ willingness to travel. Here is how the top 50 break down by location.
Las Vegas: the dominant trade show city
More than 20 of the 50 events on this list are held in Las Vegas. The Las Vegas Convention Center alone has over 4.6 million square feet of exhibit space, and the city hosts nearly six million convention attendees annually. Events across automotive (SEMA, NADA), construction (World of Concrete, IBS), technology (CES), security (ISC West), food (MAGIC), and dozens of other sectors congregate here because the infrastructure simply exists at scale nowhere else.
For exhibitors, this concentration has a practical implication: if you plan to attend multiple events in a year, a Las Vegas presence is almost inevitable. Having a universal lead capture system that works across different event badge systems — rather than relying on each organizer’s proprietary retrieval tool — becomes especially valuable when you are operating across multiple Las Vegas shows.
Chicago: manufacturing, healthcare, and food service
Chicago’s McCormick Place hosts some of the most technically demanding events on this list. IMTS (manufacturing technology), Pack Expo (packaging), RSNA (radiology), ASCO (oncology), and the National Restaurant Association Show all call Chicago home. The audience profiles at Chicago events tend to skew heavily towards industry professionals and buyers rather than general consumers — which is good news for B2B exhibitors.
Orlando, Anaheim, and the secondary hubs
Orlando (IAAPA, HIMSS, InfoComm in prior years), Anaheim (NAMM, Natural Products Expo West, IPC APEX), and Washington DC (AAP, SATELLITE, TRB) round out the secondary clusters. These cities offer lower hotel costs than Las Vegas or New York but still provide strong venue infrastructure for mid-scale events.
Niche venues with outsized audiences
A handful of events deliberately avoid the convention center circuit. EAA AirVenture Oshkosh is held at Wittman Regional Airport in Wisconsin, drawing nearly 700,000 people to a mid-sized city. The World Dairy Expo runs out of the Alliant Energy Center in Madison, Wisconsin. These venue choices are intentional — the event is the destination, and the audience travels specifically for it. For exhibitors, that signals extremely high engagement and low distraction.
Industry breakdown: which sectors dominate the top 50?
The 50 events span 25 distinct industry categories. Here is a summary of the major sectors and what they mean for exhibitors working within or adjacent to each.
Technology and electronics
CES and Dreamforce are the two flagship technology events in the US by attendance, but their exhibitor profiles are very different. CES is a launch pad — the global media presence is unmatched and the audience is broad. Dreamforce is ecosystem-specific: if you sell to Salesforce customers or integrate with the Salesforce platform, there is no better room in the world. For most B2B technology vendors, Dreamforce delivers higher lead quality per dollar spent. For both, the case for a dedicated post-event follow-up strategy is especially strong — attendees leave these shows overwhelmed with content, and the vendors who follow up within 24 hours win disproportionately.
Manufacturing and construction
IMTS (manufacturing technology) and IBS (builders’ show) represent the two largest non-tech professional events on this list. Both serve audiences with long buying cycles and technical evaluation processes. Exhibitors at these events typically invest in detailed product demonstrations rather than quick scans, and the conversations that happen on the floor often take six to twelve months to close. That makes pre-event qualification and post-event lead nurturing — not just capture — the most important part of the strategy.
Healthcare and life sciences
Healthcare events on this list range from large hospital IT conferences (HIMSS) to specialty clinical meetings (ASCO, AAOS, ACC, ASH, AAP). The common thread is a very high decision-maker concentration in a relatively small crowd. HIMSS, for example, draws 25,000 professionals from over 88 countries — a fraction of CES’s attendance, but with a far higher percentage of C-suite and senior procurement titles. Lead scoring is particularly important at healthcare events, where a single qualified conversation can represent seven-figure deal potential.
Agriculture
Agriculture contributes three of the highest-attendance events on this entire list — EAA AirVenture, the National Farm Machinery Show, and World Ag Expo. These audiences are practical, product-focused, and often arrive with purchasing authority. The exhibitor experience at agricultural shows is unlike any other: outdoor demonstrations, working machinery, and a culture of direct conversation rather than passive browsing.
How to evaluate any event on this list before committing
The number one mistake exhibitors make is choosing events based on attendance figures alone. A 200,000-person show where your target buyer represents 2% of the crowd gives you 4,000 potential conversations. A 30,000-person show where 60% fit your ICP gives you 18,000. The math is not complicated — but it is consistently ignored.
Use the following framework to evaluate any event before committing budget. It takes about 20 minutes per event and will immediately separate the worthwhile investments from the ones that look good on the marketing calendar.
| Factor | What to look for | Red flag | Green flag |
| Audience fit | Does the attendee profile match your ICP? | Broad consumer mix with little B2B segmentation | Published buyer / decision-maker percentage |
| Lead volume potential | Estimated number of qualified conversations you can have | 250,000 attendees but 90% consumer | 40,000 attendees, 70% procurement titles |
| Competitive density | How many direct competitors will be on the floor? | Your category has 50+ exhibitors in one hall | You are one of 3–5 vendors in your category |
| Cost per conversation | Total event cost ÷ realistic qualified meetings | Above $500 per qualified conversation | Under $200 per qualified conversation |
| Follow-up complexity | Can you reach leads post-event without event-organizer lock-in? | Badge data locked behind organizer API, no export | Open badge scanning or universal lead capture supported |
| 🎯 Exhibitor tip: the five-question pre-commitment checklist |
1. Can I get the attendee title breakdown from the organizer? (If they refuse or hedge, that tells you something.) 2. How many of my direct competitors exhibited last year, and what size were their booths? 3. What is the organizer's lead retrieval system, and does it support data export to my CRM on the day? 4. What is my realistic cost per qualified conversation, not cost per badge scan? 5. Do I have a follow-up system in place before I book the booth space? |
The last point is not rhetorical. Research consistently shows that following up within 24 to 48 hours of first contact increases conversion rates dramatically — yet most exhibitors still send generic emails a week after the show. momencio’s event lead capture and follow-up platform is specifically designed to close this gap, with real-time lead enrichment, personalized LiveMicrosites™, and IntelliStream™ engagement tracking that shows you exactly when a lead revisits your content after the show.
Making the most of your presence: lead capture at large-scale events
Showing up at any of the events on this list is not a strategy. It is a starting point. The exhibitors who consistently generate pipeline from these events share one characteristic: they treat the show floor as the beginning of the sales process, not the end of it.
Before the event: preparation sets the ceiling
Most event outcomes are determined before a single badge is scanned. Define your lead qualification criteria in advance. Know exactly what a qualified conversation looks like at this specific event — the title, the company size, the buying stage, the trigger question that separates genuine interest from polite browsing. Brief your team on these criteria before they leave for the show.
If the event supports pre-registration data, use it. Upload your target account list to your lead capture system before the show so that when a target account badge is scanned, your team immediately has context — account history, open opportunities, prior touchpoints.
During the event: capture context, not just contacts
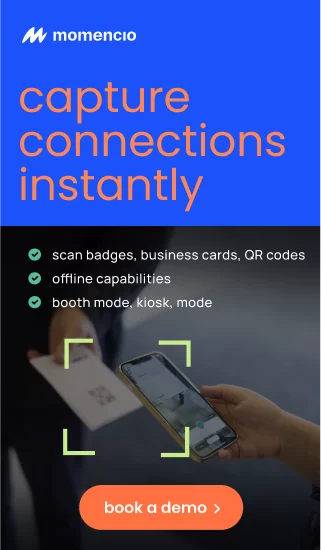
A badge scan gives you a name and a company. It does not give you a deal. What distinguishes high-converting event leads is the context your team captures during the conversation: what problem they are trying to solve, what their timeline looks like, who else is involved in the decision, and what content they engaged with at your booth. AI EdgeCapture™ and smart notes in momencio allow your team to capture this context in real time, without slowing down the conversation.
Engagement scoring should happen on the floor. Not every lead deserves the same follow-up — and your team knows within minutes of a conversation which contacts are genuinely interested. AI IntelliSense™ gives exhibitors real-time behavioral scoring across the event footprint, so your team leaves the show with a prioritized pipeline, not a flat CSV.
After the event: the 48-hour window
The data is unambiguous on this point. Follow up within 48 hours or accept that most of your leads will go cold. Attendees return from large events to overflowing inboxes, deferred decisions, and new priorities. Every hour you wait narrows the window.
Automated, personalized follow-up is not a shortcut — it is the standard. The leads who attended CES or Dreamforce or IMTS are sophisticated buyers who receive dozens of post-show emails. Generic follow-ups are deleted. Personalized LiveMicrosites™ that reference the specific conversation, the content they viewed at your booth, and the next step you agreed on — those get opened, revisited, and forwarded to decision-making colleagues.
Choosing the right events, then making them count
The 50 events on this list collectively attract tens of millions of attendees and represent some of the most significant business development opportunities in the world. But the gap between showing up and generating measurable pipeline is wide — and it has nothing to do with how big the show is.
The exhibitors who win at these events do three things differently. They choose events based on audience fit and conversion potential, not badge counts. They arrive with a qualification framework and lead capture system already in place. And they follow up faster, more personally, and more persistently than their competitors.
If you are planning your 2026 event calendar and want to understand where your process is currently breaking down — across event selection, on-site execution, and post-show follow-up — momencio’s Trade Show Readiness Diagnostic is a useful starting point. It takes about three minutes and gives you a scored breakdown of your current process with specific gaps identified.
You can also explore momencio’s full event intelligence platform to see how leading exhibitors are combining universal lead capture, AI-powered enrichment, and real-time engagement tracking to turn event attendance into attributable revenue.