
everything you need. nothing you miss.
momencio’s Event Dashboard shows you exactly what’s happening—live. From lead capture to rep performance to asset engagement, you get the full picture, the moment it matters.
Lead-Level Personalization
Modular Asset Delivery
Edit or update After Sending
Unique Link per Lead
Live Engagement Tracking
your event, fully visible. in real time.
The Event Dashboard gives you live visibility into everything that drives event success—from lead volume to rep performance to follow-up quality.
No more waiting on post-show reports. No more guessing who’s pulling their weight. You see what’s working—and what’s not—while the event is still happening.
Whether you’re tracking conversion funnels, monitoring content engagement, or measuring cost per lead, the dashboard pulls it all into one unified view.
You’re not just running events. You’re running them smarter.
Built for the floor. designed for the follow-through.
The Event Dashboard isn’t just a report. It’s a control center—tracking the moments that matter while they happen, and surfacing the insights that drive pipeline long after the booth closes.
🟢 Live mode: When the event is on
📊 Leads captured (Live)
Track new leads in real time—see who captured them and how you’re pacing against target.
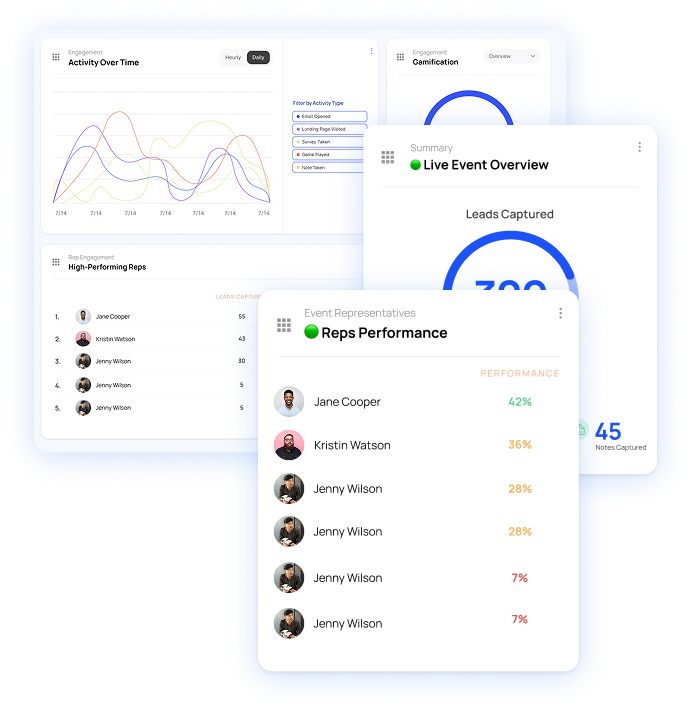
👥 Rep performance & goal rate
Monitor team performance across lead count, follow-ups, and asset shares—live.
🗓 Attendees over time
See booth traffic peaks and dips as they unfold.
🧾 Live activity feed
Watch the feed of scans, forms, notes, and engagement populate in real time.
📝 Notes & smart tags
See conversations captured instantly—tagged by follow-up urgency and topic.
📈 Peak engagement alerts
Identify your highest-performing windows for staffing and follow-up.
🔄 Always-on mode: After the event ends
🎯 Lead quality & qualification
Score leads against your ICP and view top-qualified profiles.
📬 Follow-up performance
Track email opens, clicks, landing page visits, and CTAs triggered.
📂 Asset engagement
See what content your leads viewed, for how long, and who came back.
📉 Conversion funnel
Visualize the path from lead to qualified to pipeline.
💰 ROI & CPL metrics
Track cost-per-lead and projected return based on live lead value inputs.
🕹 Surveys & gamification
Measure engagement beyond the pitch—participation rates, scores, and time spent.
Built for the floor. designed for the follow-through.
Reallocate reps. Shift tactics. Prioritize time. When you can see what’s working live, you stop reacting and start optimizing.
No more guessing who’s performing. You see goals hit, follow-ups made, and gaps in real time—while there’s still time to fix them.
The Dashboard surfaces lead quality, interest level, and engagement as it happens—so you know who’s ready before they cool off.
From cost-per-lead to asset effectiveness, you get real performance—not just post-event “impressions.”

AI Intellisense™
Your event data just got a brain.
Turn booth buzz into revenue signals. AI IntelliSense™ connects every conversation, touchpoint, and behavior — so you know who’s ready to buy, what moved them, and what to do next.
- AI-powered lead analysis: sentiment, intent & buyer fit
- Dynamic engagement score with timeline view
- Smart Actions to increase conversion odds (with ROI impact)
- AI-written contact summaries for instant context
Stop attaching files. Start sending experiences.
Every asset personalized. Every lead tracked. Every moment actionable.
event dashboard FAQs
Leads captured (live), pacing against target, rep performance and goal hit rates, attendee traffic over time, a live activity feed of every scan and form fill, notes and smart tags as they’re added, peak engagement windows, and a New vs. Returning visitor breakdown.
Yes. New vs. Returning is a dedicated metric on the Performance Overview, updated live. You see the percentage split and the underlying contact records — no need to dig through activity logs.
Yes, live. Each rep’s lead count, follow-up actions, asset shares, and goal completion rate are visible in real time. No more guessing who’s pulling their weight.
Yes. Plug in your event costs and projected lead value, and momencio calculates cost-per-lead, projected revenue, and ROI live. Updated as leads come in.
Yes. Asset-level engagement (views, scrolls, downloads, replays) is shown per lead via the IntelliStream connection — so you know what each contact actually cared about, not just that they “engaged.”
Yes. Cross-event reporting lets you compare lead volume, quality, conversion funnel, and ROI across your full event portfolio.
Actually live. Scans, clicks, and submissions populate the moment they happen. No “data refreshes hourly.” No “available the next business day.”