Most event teams can measure obvious things. They know how many people registered, how many showed up, and how many badges were scanned. Those numbers feel useful, but they do not answer the question leaders always ask: How much revenue did this event deliver? This article explains how to take the event metrics you already gather and make a clear, defensible link to pipeline, opportunities, and closed deals.
Looking past the surface numbers
Events produce many surface metrics. Registrations, attendance rates, booth scans, session ratings, and social activity are common. These numbers tell you about activity. They do not prove business impact. A full room can still leave no new customers. A long list of scans can include poor quality names. Positive session scores are not the same as pipeline growth.
Three common traps to avoid
- Counting every scan as a lead. Many scans are low quality.
- Reporting registrations as success. Many registrants never attend.
- Treating positive feedback as a sales signal. Satisfaction and sales are different.
Those traps cause teams to present shiny reports that do not convince finance. To connect metrics to revenue you must move from counting to tracking progress toward deals. In a report co-published with HBR, 739 respondents (enterprise marketers) revealed that only ~23% of companies say they can calculate ROI for events.

Which event metrics connect to revenue
Focus on a short list of measures that show movement toward revenue. Keep it tight. Here are six metrics with plain reasons they matter.
Metric #1: Lead engagement depth
- What it shows – People who view demos, visit microsites, or request follow ups.
- Why it matters – Deeper engagement predicts higher conversion and deal value.
Metric #2: Stage progression
- What it shows: How many event leads move to qualified status or opportunity stage.
- Why it matters: Progress shows the event moved leads down the funnel.
Metric #3: Closed deals
- What it shows: Deals that can be traced to event interactions.
- Why it matters: This is direct dollar evidence you can show to leaders.
Metric #4: Influenced pipeline
- What it shows: Existing opportunities that advanced faster after the event.
- Why it matters: Events often accelerate pipeline even if they do not start deals.
Metric #5: Net revenue
- What it shows: Actual revenue after discounts, refunds, and churn.
- Why it matters: This keeps your report honest and defensible.
Metric #6: Cost per revenue dollar
- What it shows: How much you spent to generate each dollar of revenue.
- Why it matters: This compares efficiency, not just outcomes.
How to track impact in practice
Follow these steps to connect event activity to revenue without overcomplication.
- Step 1: Tag at source
When you capture a lead, tag it with the event name and date in your CRM. This single step enables tracking later.
- Step 2: Create a cohort
Group event leads and follow them as a set. Track how many move to qualified, how many become opportunities, and how many close.
- Step 3: Record depth of action
Log demos, microsite visits, downloads, and meeting notes. These actions show interest beyond a quick scan.
- Step 4: Pick an attribution model and stick to it
Choose first touch, last touch, or a simple multi touch split. Use the same rule for all events so your reports are consistent.
- Step 5: Set a clear time window
If your normal sales cycle is ninety days, measure event impact for ninety days. Do not stretch windows to include unrelated conversions.
- Step 6: Run comparisons
Compare conversion and close rates between event leads and non event leads to show relative performance.
- Step 7: Audit and clean the data
Remove duplicates, filter out meaningless scans, and verify contact quality. Clean data builds trust with finance.

What event professionals often wonder
You attend a trade show and scan five hundred contacts. Two hundred of those contacts visit your follow up microsite. Fifty request demos. Twenty become opportunities. Five close within three months for a total of three hundred and fifty thousand dollars in revenue. Ten existing opportunities that visited the booth progress faster and add six hundred thousand dollars in influenced pipeline. When you add direct and influenced revenue you tell a clearer story than with scans alone.
Executive considerations
Once you have examples like this, the real work begins — presenting them in a way that satisfies senior leadership. At this level, activity counts no longer matter. Executives are asking harder questions:
- How do we avoid overstating impact?
Your event report must show discipline. Adjust results by excluding low-quality scans, applying time windows that match your sales cycle, and comparing event leads to non-event leads. A conservative approach builds trust.
- How do we compare against other channels?
No executive looks at events in isolation. They want to know whether events outperform digital campaigns, outbound sales, or partner programs. This means you must calculate cost-per-pipeline and cost-per-revenue dollar using the same formula as other channels.
- How do we balance short-term and long-term influence?
Events rarely drive all revenue immediately. Some deals close in the same quarter, others get influenced and move faster later. Reporting both direct closed revenue and influenced pipeline gives a balanced picture.
- What is the risk of not attending?
Leaders also consider competitive presence. If your main rivals show up and you do not, the cost is lost visibility and lost influence. Including this perspective makes your case stronger, even if the numbers are not as easy to quantify.
- How do we justify future budgets?
The most practical question is whether the spend should be repeated. Executives expect a repeatable model. Show how each dollar spent turned into pipeline or revenue this year, and outline how you will refine that ratio next year. That turns an event https://eskaparate.co/contacto/ from a one-off activity into a planned investment.
By shifting the conversation from surface metrics to these executive considerations, you move the discussion into territory that decision makers care about: defensibility, comparability, risk, and future planning. That is what transforms your event report from a recap into a budget-winning business case.
How momencio turns metrics into revenue proof
You don’t need to build your own dashboard or stitch together data from ten tools. momencio is built so that all the pieces of your event metrics connect automatically — from lead capture to funnel outcome. Here’s how it supports the practical roadmap steps you already understand.
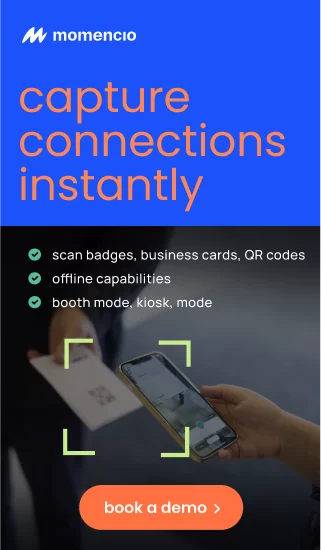
Lead capture without friction
At your booth, contacts can be captured through badge scans, QR scans, or business card scans. momencio digitizes those records immediately so they are ready for enrichment and follow up — no messy spreadsheets or manual entry.
Automatic enrichment with AI EdgeCapture
Leads don’t stay raw. momencio’s AI EdgeCapture enriches every contact with professional and company information, both at the point of capture and later inside the platform. That means sales sees a complete profile rather than a partial name list.
Unified engagement view with IntelliStream
A single contact record holds every action: scans, microsite visits, content downloads, video views, and email interactions. momencio’s IntelliStream makes these touchpoints visible in one timeline so marketing and sales can see depth of engagement, not just activity counts.
Personalized microsites and follow up
Instead of a generic thank you, every lead can be sent a personalized microsite that includes relevant content, assets, or demo links. Engagement with those microsites is tracked in real time, adding another layer of measurable intent signals.
Real-time dashboards and analytics
momencio doesn’t wait for end-of-event reports. Dashboards show live performance — leads acquired, booth engagement, content usage, pipeline contribution, and ROI. Decision makers can monitor results as the event unfolds.
Seamless CRM and marketing automation sync
All enriched and engagement-tracked data flows back into CRM and marketing systems. That keeps sales working from accurate records, while marketing can report on pipeline and revenue impact without manual reconciliation.
Why this matters
With momencio, metrics move beyond surface reporting. You can show not just how many people you met, but how those people engaged, how they were enriched, how they were followed up, and how many deals they influenced or closed. The dashboards https://lakerenterprises.net/ and streams tie it all together, so your event report speaks in the language executives expect — pipeline, revenue, and ROI.
Ready to see how momencio connects every event metric to revenue? Book a demo and watch it in action.