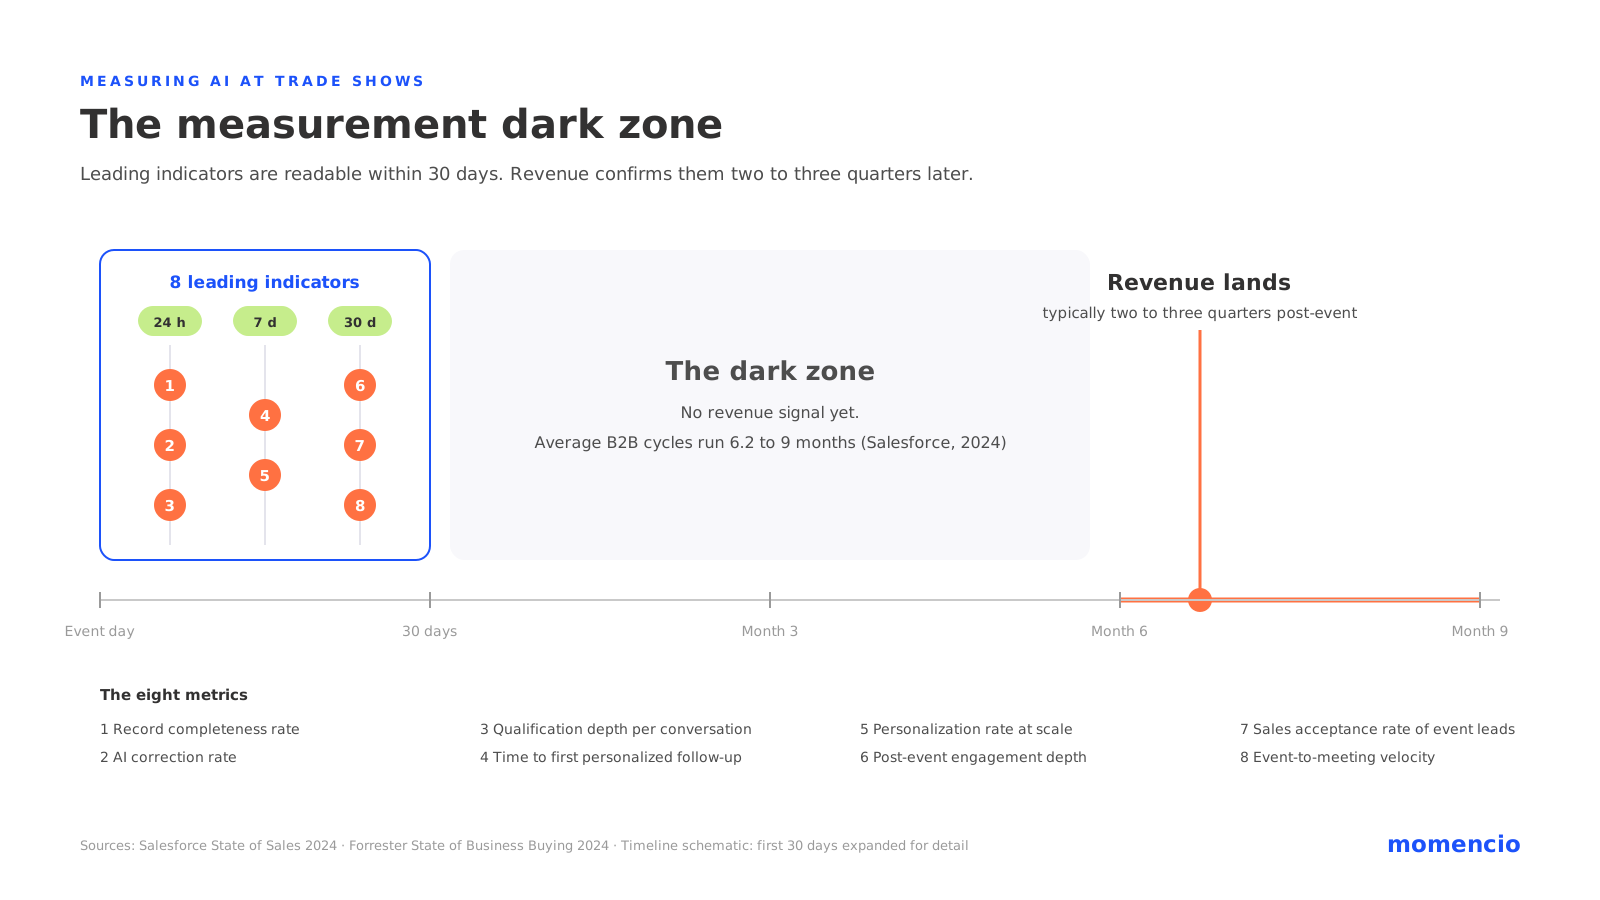
The AI line item on your event budget has a problem that has nothing to do with whether the technology works. It is a timing problem. Salesforce’s State of Sales research puts the average mid-market sales cycle at 6.2 months, with enterprise deals running 7 to 9 months, and Forrester’s State of Business Buying study found that 86% of B2B purchases stall somewhere along the way.
A lead your team captures at a March trade show may not turn into revenue until October. The budget review that decides whether your AI tools survive happens in April.
Field marketers who wait for pipeline to defend the investment lose that argument by default. The teams that keep their budgets measure differently. They track leading indicators: metrics that move within days of the show, sit directly upstream of revenue, and isolate what the AI changed rather than what the event produced.
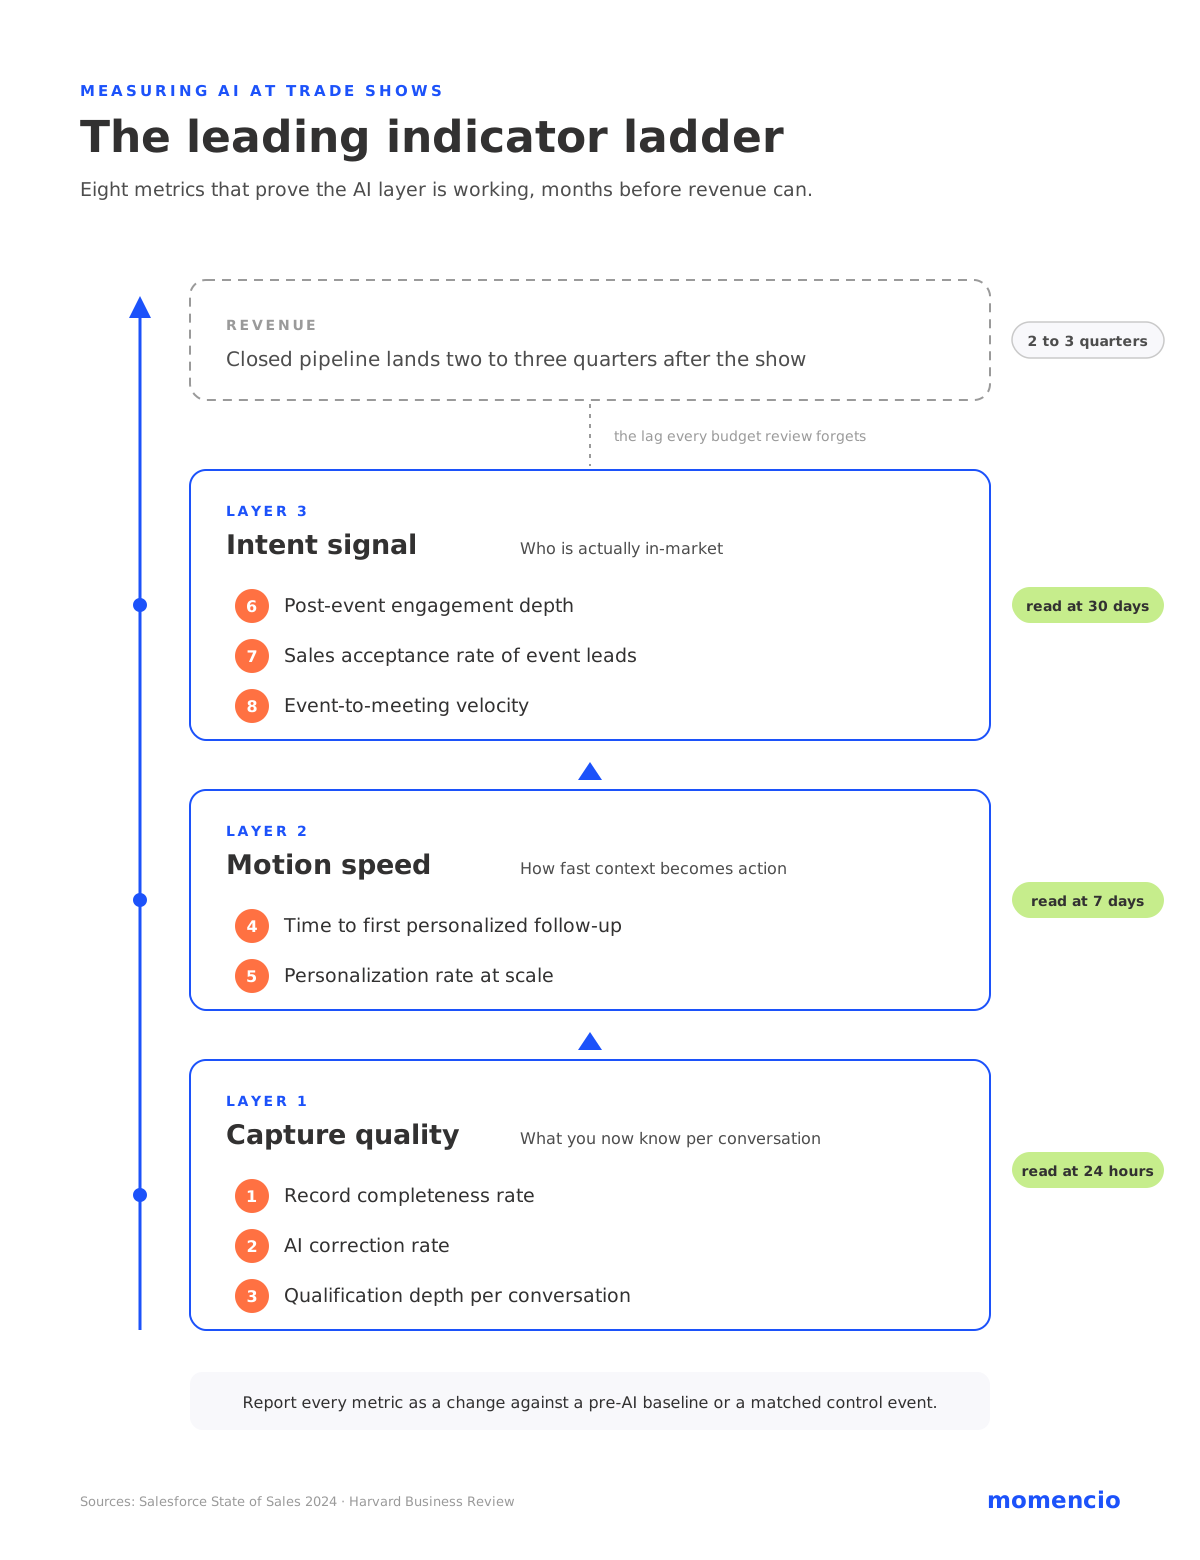
This article gives you eight of them, organized into three layers you can read at 24 hours, 7 days, and 30 days after the doors close.
Why revenue is the wrong first scorecard
Forrester’s Q1 2026 State of B2B Events Survey, which gathered responses from more than 400 event decision-makers globally, found that over 90% of organizations now rank showing impact and maximizing the value of event data among their top priorities. The same research stream shows AI adoption at events concentrated in content creation, with most teams describing themselves as still in learning mode on everything else. Adoption has moved faster than measurement, and that gap is where AI programs quietly die.
The instinct to prove AI with revenue is understandable and wrong for two reasons.
First, the timing fails: with cycles running six months or longer, revenue evidence arrives one to three budget reviews too late.
Second, the attribution fails: by the time a deal closes, sales execution, pricing, competitive dynamics, and three quarters of nurture have all touched it, so nobody can say which dollar the AI earned. A useful AI metric has to do three things instead: move within days or weeks, sit on the causal path to pipeline, and change measurably when the AI is present versus when it is not.
Measure the change, not the number
Every metric in this article is a delta. A 68% record completeness rate means nothing on its own; a 68% rate against a 41% manual baseline is a result you can put in front of a CFO. Before you report anything, build the comparison point. You have two options. Benchmark one full event cycle before the AI rollout, capturing the same eight numbers by hand, or run paired events in the same tier, one with AI support and one without, and compare.
Tier discipline matters more than most teams expect. A tabletop at a regional show and a 20 by 20 booth at a national flagship produce different numbers for structural reasons that have nothing to do with technology, so a valid comparison holds the event class constant. Get the baseline right once and every number that follows becomes defensible.
The delta rule: report every AI metric as a change against a pre-AI baseline or a matched control event. A number without a baseline is an anecdote.
Layer 1: capture quality, read at 24 hours
The first layer answers a single question: did the AI improve what you know about each conversation while the conversation was still warm? These three numbers become readable the morning after the show closes.
-
Record completeness rate
Count the share of captured leads that hold a complete working record within 24 hours of capture: a validated business email, job title, company, and at least one qualification field. Define that minimum viable record before the show, because the definition is the metric.
The economics here are blunt. Gartner estimates that poor data quality costs the average organization $12.9 million a year, and MarketingSherpa’s research puts B2B contact data decay at roughly 2.1% per month, which means a record that leaves the show incomplete rarely gets healthier later.
AI earns its place at this layer through enrichment at the point of capture, appending firmographics and validating contact details while the attendee is still in the aisle. Modern AI lead capture treats the scan as the start of a record rather than the record itself. Audit completeness the morning after close and report it against your manual baseline.
-
AI correction rate
Track the share of AI-captured or AI-enriched records that a human had to fix: a misread badge, a wrong title, a company matched to the wrong entity. This is the trust metric, and almost nobody tracks it, which is exactly why AI programs fail silently. When correction rates run high, reps stop trusting the output, stop using the tool, and never file a complaint; the first visible symptom is every downstream metric decaying at once.
Sample 10% of records within a week of the show, log corrections at the field level, and trend the rate across events. The direction matters more than the level. A correction rate that falls show over show tells you the system is learning your audience and your data sources. A flat or rising rate tells you where the model needs configuration before you spend anything else on the stack.
-
Qualification depth per conversation
Score every lead from 0 to 5 on the number of decision-grade signals attached to it: need, timeline, authority, competitive context, and an agreed next step. Then report the distribution rather than the average, because an average hides a pile of zero-signal badge scans behind a few well-documented conversations.
CEIR research finds that 81% of trade show attendees hold buying authority. The people at your booth are qualified; the records they leave behind usually are not, because qualification lives in the conversation and dies in the transcription gap. Voice notes that AI transcribes and structures into fields close that gap on the spot, which is why this metric responds to AI faster than almost any other.
The reframe matters as much as the number: depth per conversation replaces badge count as the thing your booth team gets measured on, and behavior at the booth changes within one show.
Layer 2: motion speed, read at 7 days
The second layer measures whether captured context becomes action while attention is still live. Salesforce’s State of Sales research finds reps spend roughly 30% of their week actually selling, so the post-show follow-up backlog competes with every other demand on their time. Speed decays by default, and this is where AI has to prove it changes the physics.
-
Time to first personalized follow-up
Measure the median hours from capture to the first follow-up that references the actual conversation, and track the share of leads reached within 24 hours alongside it, because a healthy median can hide a long tail of leads nobody touched.
The benchmark data makes the case for you. Harvard Business Review’s audit of 2,241 companies found an average lead response time of 42 hours, with 23% of companies never responding at all, and firms that made contact within an hour proved nearly seven times as likely to qualify the lead as those that waited even one hour longer. Exhibitor Magazine’s research shows only 20 to 30% of exhibitors follow up within 48 hours of a show.
This is the layer where the AI case is easiest to see on the floor. momencio captures a badge or card with AI EdgeCapture™, enriches the record on the spot, and drafts follow-up from the captured context with AI IntelliSense™, with a personalized LiveMicrosites™ page as the destination, so the first relevant touch can land before the attendee reaches the airport. Whatever stack you run, the target does not change: a personalized touch on the same day.
-
Personalization rate at scale
Pull 20 random follow-ups per event and count how many reference something specific from the booth conversation: a question asked, a use case discussed, a next step agreed. That share is your personalization rate, and it is the honest counterweight to metric four, because speed without relevance is just faster spam.
McKinsey’s Next in Personalization research found that 71% of buyers expect personalized interactions, that 76% get frustrated when those interactions are absent, and that faster-growing companies derive 40% more of their revenue from personalization than slower-growing peers. A human team can choose speed or specificity; delivering both at volume is the capability AI actually adds. If this rate is not climbing after rollout, the system is automating the wrong half of the job.
Layer 3: intent signal, read at 30 days
The third layer asks whether the system surfaces real buying intent earlier than instinct would. This is the point where lead capture matures into event intelligence: behavior after the show, read systematically, telling you who is in-market now.
-
Post-event engagement depth
Define an engagement ladder before the show: opened, viewed the content, spent two or more minutes with it, returned for a second session, shared it onward. Then report the share of leads reaching rung three or higher over 30 days. Raw open rates test your subject line; depth behaviors are the earliest evidence that what you captured and how you followed up created genuine relevance.
Depth data also feeds everything downstream. It sharpens scoring ahead of the acceptance review in metric seven, tells reps which conversation to resume first, and gives you the first honest read on whether the AI’s personalization is producing interest or just activity.
-
Sales acceptance rate of event leads
Measure the share of AI-qualified leads that sales formally accepts and starts working within five business days of handoff. This is the earliest number in the whole framework that correlates with revenue, and it is also the falsification point: human judgment saying yes or no to the machine’s yes.
Run the acceptance review as a standing meeting rather than an email thread, and log every rejection reason. Wrong persona, no budget signal, bad timing, duplicate account: each one is free training data for your scoring rules. An acceptance rate that climbs across two or three shows is the strongest pre-revenue evidence you can put in front of leadership, because it means the people carrying quota trust the machine’s judgment with their time.
-
Event-to-meeting velocity
Track the median days from capture to first booked meeting, plus the share of leads that book within 14 days. This is the last milestone you can observe before pipeline forms, and it is where the upstream layers either compound or expose a leak. If metrics four through six improved and this number did not move, the problem sits in handoff and territory routing rather than in the AI.
CEIR’s cost data gives this metric its edge in a budget conversation: a qualified trade show lead costs an average of $811 to close, against $1,039 to $1,356 for a field sales lead. Velocity is what protects that cost advantage, because the show lead’s edge is context and timing, and both expire.
The numbers that lie to you
Four metrics dominate post-show reporting and prove nothing about AI. Badge scan volume measures foot traffic and scanning discipline. Total leads captured rewards a bigger pile of shallow records, which is a worse outcome dressed up as growth. Tool logins and seat activation measure attendance at the tool, while the correction rate in metric two is the honest adoption signal, because reps only keep using output they no longer have to fix. Raw open rates test a subject line and nothing else.
Each of these fails the same test: it either sits off the causal path to revenue or moves for reasons that have nothing to do with the AI. Reporting them next to the eight above does more than waste a slide, because it teaches leadership to associate your AI program with numbers that never cash out.
The 24-hour, 7-day, 30-day scorecard
Assembled into a cadence, the eight metrics become a reporting rhythm leadership can follow without a methodology lecture.
| Checkpoint | Metrics | The question it answers |
| 24 hours | 1, 2, 3 | Did we capture decision-grade records? |
| 7 days | 4, 5 | Did we act while attention was still live? |
| 30 days | 6, 7, 8 | Did we surface real intent, and did sales accept it? |
Run the scorecard for two or three shows and something useful happens: when revenue finally lands two or three quarters later, you hold an unbroken evidence chain connecting the closed deal back to a completeness delta, a same-day follow-up, and an accepted lead from a specific show. That chain is the difference between renewing the AI line item on evidence and defending it on faith. The cleanest way to start is small: pick one event, benchmark it honestly, run the next one with the AI layer switched on, and let the deltas argue for you.
Frequently asked questions
- How long does it take for AI at trade shows to show revenue impact?
- Expect two to three quarters. Salesforce’s State of Sales data puts average mid-market cycles at 6.2 months and enterprise cycles at 7 to 9 months, so a lead captured today typically closes two or three budget reviews from now. The eight leading indicators in this article exist to give you defensible proof at 24 hours, 7 days, and 30 days instead.
- What is a good follow-up speed benchmark after a trade show?
- Aim for a personalized touch within 24 hours of capture. Harvard Business Review’s audit found an average lead response time of 42 hours and a nearly sevenfold qualification advantage for companies responding within the first hour, while Exhibitor Magazine’s data shows only 20 to 30% of exhibitors follow up within 48 hours. Same-day, conversation-specific follow-up clears a bar most of the market misses.
- How do you separate AI impact from overall event performance?
- Use baseline deltas. Benchmark one event before rollout or run paired events in the same tier with and without AI support, then report every metric as the change rather than the raw number. Hold the event class constant, because booth size and show tier move the numbers for reasons unrelated to the technology.