
Pattern 1: The 24-48 hour conversion cliff
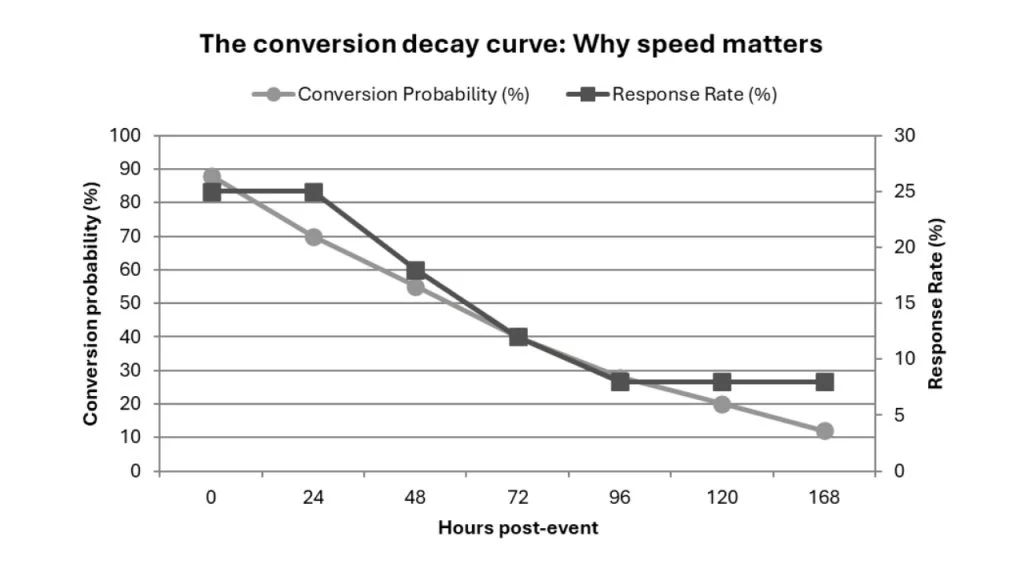
The trade show industry’s conventional wisdom recommends following up ‘within 72 hours.’ The problem is that by hour 72, conversion probability has already decayed dramatically.
The research: Speed-to-lead fundamentals
- Leads contacted in first 5 minutes convert 8x higher than after 30 minutes
- Contact within 1 hour = 7x higher qualification vs. after 24 hours
- Leads contacted within 24-48 hours are 60% more likely to convert than after one week
- 25% within 24 hours, drops to <8% after 72 hours
- 50% of deals go to first company to follow up
Current exhibitor practice vs. optimal timing
| Follow-up timing | % Exhibitors | Conversion window status |
| Same day | ~22% | OPTIMAL (peak memory, minimal competition) |
| 24-48 hours | ~15-20% | STRONG (60% higher conversion) |
| 3-5 days | 40% | DECLINING (memory fading, competitors acting) |
| 6+ days | 38% | POOR (<8% response rates) |
| Never | 80% | ZERO |
Multiple independent studies confirm timing-to-conversion correlation. The 72-hour window represents the outer boundary of effectiveness, not the optimal target.
Pattern 2: Behavioral signals vs. demographic qualifiers
Most exhibitor lead capture systems prioritize demographic information (job title, company size, industry). The problem: demographic qualifiers identify who prospects are, not whether they’re ready to buy.
Trade show behavioral signals
Strong intent signals
|
Weak intent signals
|
The title paradox
A C-level executive collecting a brochure may be less qualified than a manager asking detailed integration questions. Yet most lead capture systems flag the executive as ‘hot’ and the manager as ‘medium,’ inverting actual buying intent.
Pattern 3: The digital capture advantage
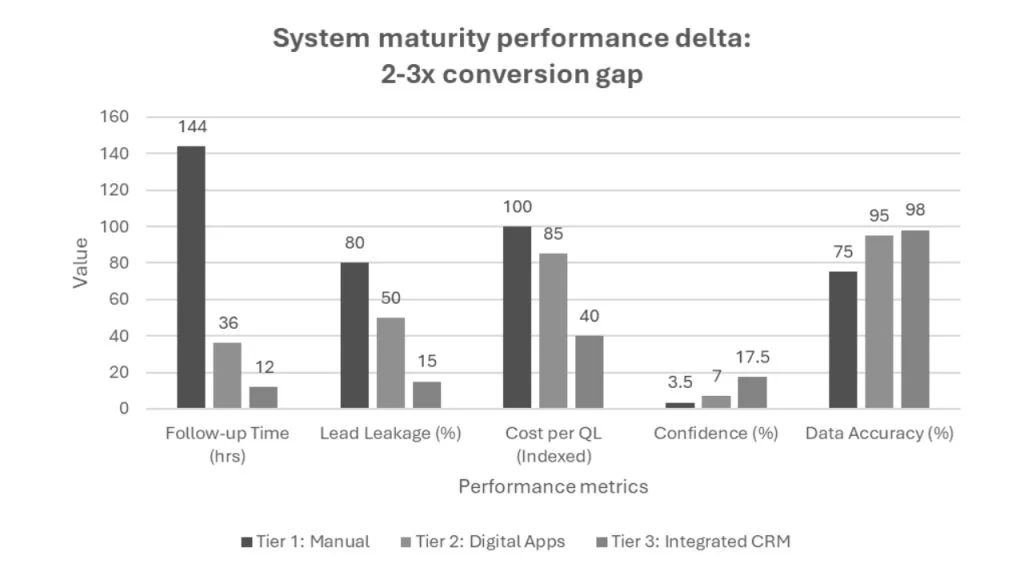
Analysis reveals three distinct exhibitor tiers with measurable performance differences:
Three tiers of exhibitor systems
| Tier | Methods | Performance | % of Exhibitors |
| Tier 1: Manual | Paper forms, business cards, spreadsheets, batch CRM upload | 6+ days follow-up ~80% lead leakage 3-4% confidence | 35-40% |
| Tier 2: Mobile apps | Standalone lead capture apps, mobile badge scanning, same/next-day CRM entry | 24-48 hours follow-up 40-60% lead leakage 6-8% confidence | 45-50% |
| Tier 3: Integrated | Real-time CRM integration, automated scoring, triggered workflows | Minutes-hours follow-up 10-20% lead leakage 15-20% confidence | 10-15% |
The mechanism: Speed, not format
The performance advantage isn’t the digital format itself—it’s the downstream effects:
- Speed: Digital enables follow-up in minutes rather than days
- Completeness: Automated capture reduces errors by 90%
- Workflow automation: Triggers immediate follow-up emails and task assignments
- Elimination of ‘black holes’: 88% of paper business cards end up in trash within a week
Pattern 4: Pre-event engagement determines on-site outcomes
76% of trade show attendees use pre-show information to plan their agenda before arriving
Research reveals that by the time doors open, three-quarters of attendees have already decided which booths to visit, which sessions to attend, and which vendors to prioritize.
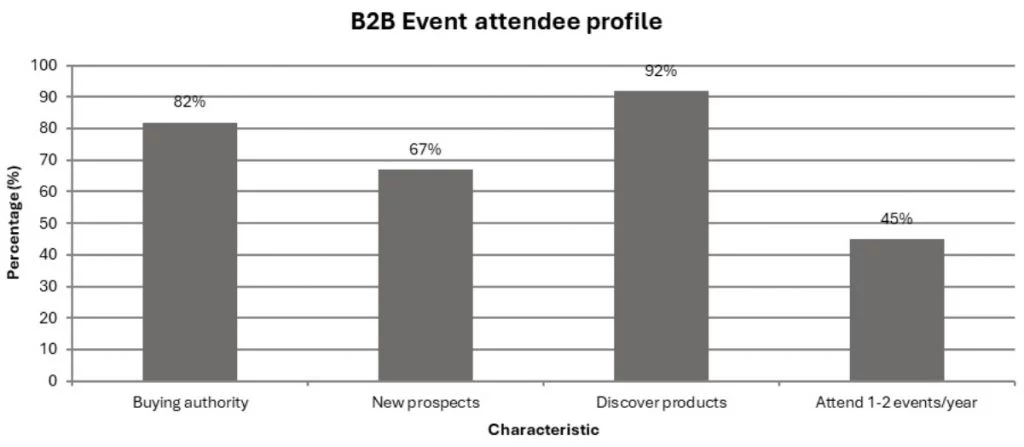
High-intent buyer profile: 82% have buying authority, 67% represent new business opportunities, yet 92% are actively comparing solutions—making pre-event positioning critical.
The IMEX pre-scheduling phenomenon
| Event | Pre-scheduled meetings | Acceptance rate |
| IMEX America 2024 | 86,000 | 80.1% |
| IMEX America 2025 | 77,000+ | 85.6% |
At IMEX 2025, attendees allocated 85.6% of their meeting time before arriving. Exhibitors who waited for walk-up traffic competed for the remaining 14.4%.
The optimal pre-event timeline
| Timeframe | Buyer Activity | Exhibitor Opportunity |
| 3-4 months | Event registration, budget approval | Booth design, staffing plans |
| 2-3 weeks | Peak meeting scheduling window | HIGHEST-PRIORITY OUTREACH |
| Event days | Walk-up traffic (24%), scheduled meetings (76%) | Booth execution |
The 2-3 weeks before event window represents optimal timing: early enough that buyers haven’t finalized agendas, late enough that the event is top-of-mind. Pre-scheduled meetings show 60% higher meaningful connection rates compared to random networking.
Pattern 5: The measurement misalignment problem
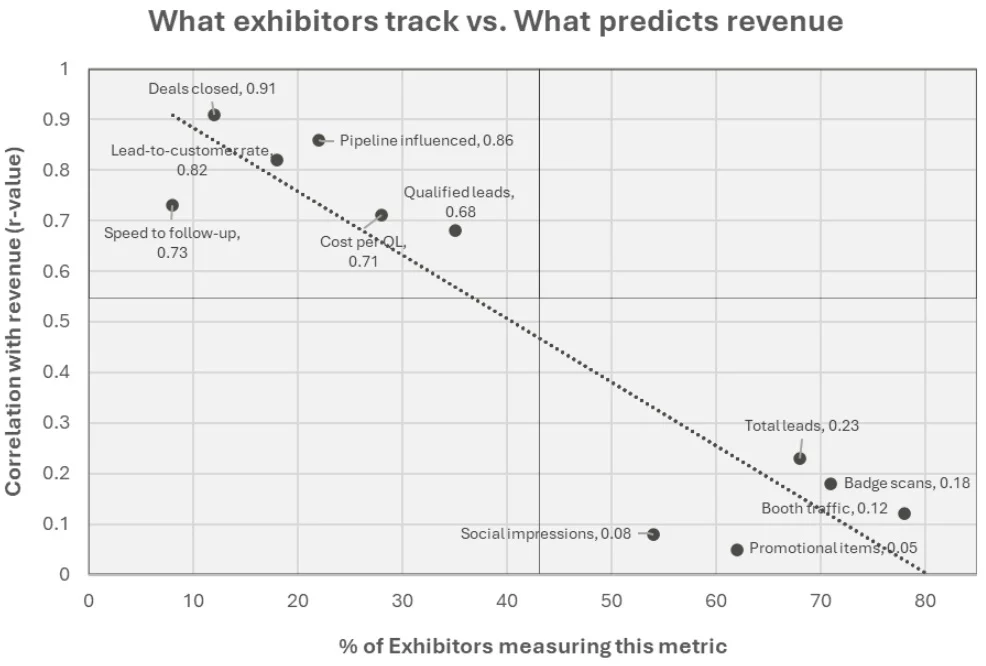
Exhibitors overwhelmingly track volume metrics (badge scans, booth traffic, leads collected) while conversion metrics (qualified lead rate, cost per qualified lead, lead-to-customer conversion, pipeline influenced) predict actual revenue outcomes.
What exhibitors track vs. what predicts revenue
| Metric type | % Measuring | Revenue correlation |
| Booth traffic | 78% | Weak (r=0.12) |
| Badge scans collected | 71% | Weak (r=0.18) |
| Qualified leads | 35% | Strong (r=0.68) |
| Cost per qualified lead | 28% | Strong (r=0.71) |
| Deals closed (attributed) | 12% | Very Strong (r=0.91) |
The quality-quantity tension
HubSpot’s 2024 Sales Trend Report confirms ‘lack of high-quality leads’ remains the top challenge for sales teams. Yet exhibitor measurement practices optimize for quantity:
- Badge scanners with minimal qualification (maximize volume)
- Success metrics based on ‘leads collected’ rather than ‘qualified opportunities created’
- Sales teams complain about quality while marketing defends based on volume—both measuring different things
The attribution challenge
B2B buying dynamics make trade show ROI measurement exceptionally difficult:
- Multiple decision-makers: Buying committees average 6-10 people
- Long sales cycles: 6-24+ months from first contact to close
- Multi-touch attribution: Trade show might be touchpoint 3 of 15
- Freeman data: Trade show ROI often has 18-24 month sales conversion timeframe
___
Cite this Report: momencio (2026). “2026 State of U.S. B2B events report” Available at: https://www.momencio.com/guide-book/state-of-b2b-events/us-b2b-event-market-baseline/